
Loading…

Harmanpreet Kaur vs Smriti Mandhana: Who Is Better? Batting and Stats Comparison
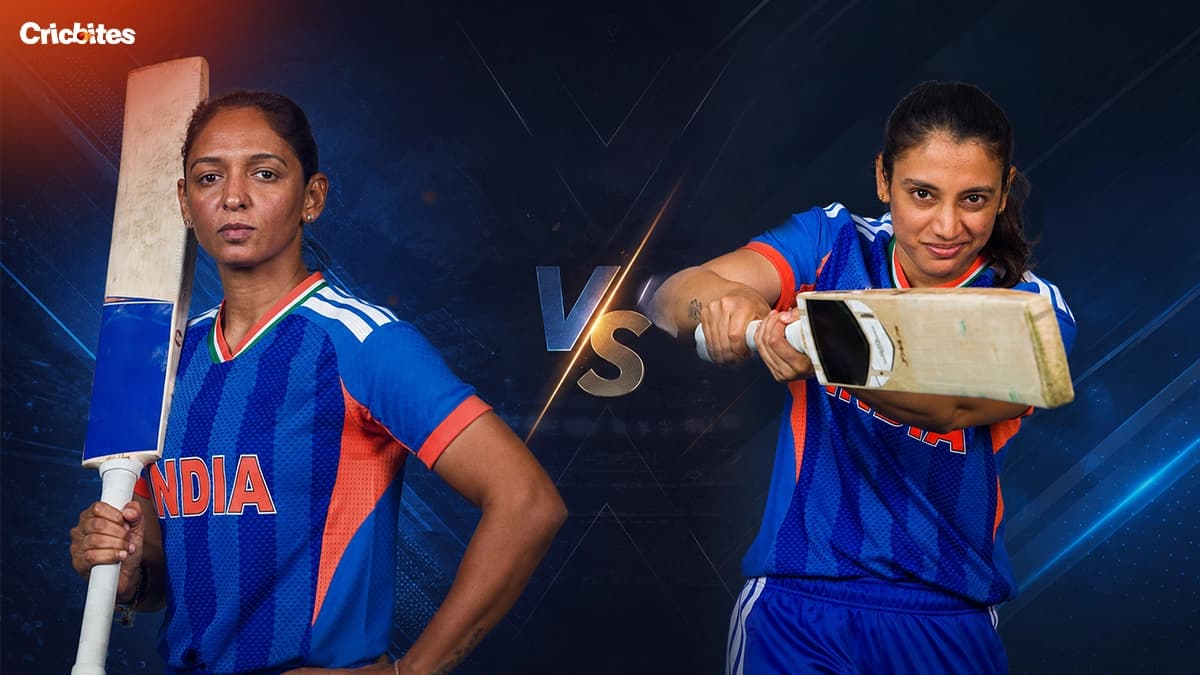
India has produced two of the most recognisable batters in women’s cricket and they could not be more different. Harmanpreet Kaur is the power-hitting captain who wins matches with aggression and technique.
Smriti Mandhana is the left-handed batter who makes bowling attacks look ordinary, relying on elegant timing and clean strokeplay rather than brute force. Both have carried Indian women’s cricket for over a decade. The numbers across Test, ODI, and T20 International cricket now settle the debate.
Test Cricket
Mandhana is the clear winner here. In 8 Tests she has scored 635 runs at an average of 48.9 with 2 centuries and 3 fifties. Her highest score is 149, and a strike rate of 63.4 reflects a batter who keeps the scoreboard moving while rarely giving away her wicket.
Harmanpreet’s Test record tells a different story. In 7 matches she has scored just 230 runs at an average of 23.0 with a highest score of 69. She has one fifty and no centuries. Her strike rate of 57.1 is also lower than Mandhana’s despite her reputation as a big hitter.
Mandhana has more than twice Harmanpreet’s Test runs, twice the average, and two centuries to Harmanpreet’s none. In the longest format, this is not a close contest. Mandhana wins Test cricket convincingly.
| Player | Years | Mat | Inn | NO | Runs | HS | Avg | BF | SR | 100s | 50s | 4s | 6s |
|---|---|---|---|---|---|---|---|---|---|---|---|---|---|
| Harmanpreet Kaur | 2014– | 7 | 11 | 1 | 230 | 69 | 23.0 | 403 | 57.1 | 0 | 1 | 27 | 0 |
| Smriti Mandhana | 2014– | 8 | 14 | 1 | 635 | 149 | 48.9 | 1002 | 63.4 | 2 | 3 | 108 | 3 |
ODI Cricket
This is where the comparison gets serious. Mandhana has played 120 ODI matches and scored 5411 runs at an average of 47.9 with 14 centuries, 35 fifties, and a strike rate of 90.4. Those are elite numbers in any era of women’s cricket.
Harmanpreet has played 164 ODIs and scored 4541 runs at 37.2 with 7 centuries, 24 fifties, and a strike rate of 76.9. She has played 44 more matches than Mandhana but has scored 870 fewer runs.
The century count is the sharpest difference. Mandhana has 14 ODI hundreds. Harmanpreet has 7. Mandhana’s average of 47.9 is more than 10 runs higher and her strike rate of 90.4 against Harmanpreet’s 76.9 means she scores faster too. Mandhana wins ODI cricket and it is not particularly close.
It is worth noting that Harmanpreet’s 171 not out remains her highest ODI score and one of the most celebrated innings in women’s cricket history. Individual brilliance does not always show up in career averages.
Related Post: Ellyse Perry vs Nat Sciver-Brunt: Comparing Batting And All-Round Stats
| Player | Years | Mat | Inn | NO | Runs | HS | Avg | BF | SR | 100s | 50s | 4s | 6s |
|---|---|---|---|---|---|---|---|---|---|---|---|---|---|
| Harmanpreet Kaur | 2009– | 164 | 143 | 21 | 4541 | 171* | 37.2 | 5908 | 76.9 | 7 | 24 | 448 | 57 |
| Smriti Mandhana | 2013– | 120 | 120 | 7 | 5411 | 136 | 47.9 | 5988 | 90.4 | 14 | 35 | 653 | 74 |
T20 International Cricket
The T20I format is where Harmanpreet has built her global reputation and the stats offer an interesting picture. Mandhana has played 167 T20Is and scored 4401 runs at an average of 30.1 with 34 fifties, 1 century, and a strike rate of 124.9 from 3523 balls faced.
Harmanpreet has played 198 T20Is and scored 4111 runs at an average of 30.2 with 17 fifties and 1 century. Her combined T20 record across all competitions shows 8923 runs from 381 matches at an average of 35.0 with 51 fifties and 145 sixes. That combined record reflects her durability and impact across the short format over a sustained period.
Looking at the T20I data available, the averages are almost identical. Harmanpreet at 30.2 and Mandhana at 30.1 are separated by just 0.1. But Mandhana’s strike rate of 124.9 and her 34 fifties compared to Harmanpreet’s 17 show that Mandhana scores faster and converts her starts more consistently at the top of the order. Mandhana edges T20I batting on available evidence.
Read Next: Deepti Sharma vs Amelia Kerr: Comparing Their Batting Stats And Records
| Player | Years | Mat | Inn | NO | Runs | HS | Avg | BF | SR | 100s | 50s | 4s | 6s |
|---|---|---|---|---|---|---|---|---|---|---|---|---|---|
| Harmanpreet Kaur | 2009– | 198 | 177 | 41 | 4111 | 103 | 30.2 | – | – | 1 | 17 | – | – |
| Smriti Mandhana | 2013– | 167 | 161 | 15 | 4401 | 112 | 30.1 | 3523 | 124.9 | 1 | 34 | 593 | 87 |
Who Is the Better?
The statistics point clearly to Smriti Mandhana. She leads in Test batting by a wide margin, averages nearly 48 in ODIs against Harmanpreet’s 37.2, and scores at a higher strike rate in T20Is while recording twice as many fifties. Her 14 ODI centuries against Harmanpreet’s 7 is the single most telling number in this comparison.
Harmanpreet is the greater leader, the bigger occasion player, and holds one of the most destructive innings ever played in a World Cup knockout. Her captaincy and match-winning ability cannot be quantified by averages alone. But purely as a batter across all three formats, Mandhana’s stats make her the better player between the two.
Follow Cricbites for the latest cricket updates, match schedules, player news, records, rankings and expert insights from around the world.
Read More: Shubman Gill vs Prithvi Shaw: Who Is Better? Batting and Stats Comparison


